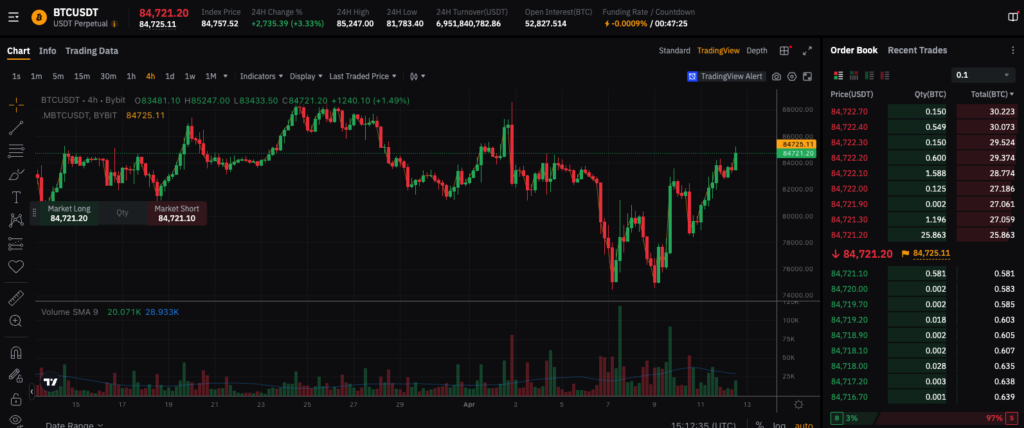
As of the latest 4H chart, Bitcoin (BTCUSDT) is trading near $84,721, continuing its recovery after a strong bounce from the $77,000 area earlier this month. The price is moving within a rising channel but now faces a key resistance zone that previously rejected upward momentum in late March.
🔹 Resistance Zones to Watch
- $85,200 – This level represents a recent local high and current resistance being tested.
- $87,000–$88,000 – A broader resistance band that has triggered sell-offs in past sessions.
🔹 Support Zones
- $82,000 – Acts as a local higher low and key short-term support.
- $78,000 – A critical structural level; a breakdown here could invalidate the current bullish setup.
🔹 Volume & Momentum
Volume remains moderate but stable, suggesting indecision. A breakout above resistance should ideally be backed by a volume spike. RSI is neutral, offering room for upward continuation, though momentum appears to be slowing slightly. Funding rates remain neutral to slightly negative, reflecting caution in the market.
🔍 Market Outlook
If BTC can close above $85,200 with strength, a push toward $87K–$88K may follow. On the other hand, failure to break this level could trigger a pullback to the $82K–$80K zone.
💡 Key Takeaway:
BTC is consolidating just below resistance. A decisive move above or rejection from $85,000 will likely set the tone for the next leg. Traders should watch for volume confirmation and shifts in funding rate or order book behavior.
📌 This is not financial advice. Please conduct your own research before making any investment decisions.