Cardano (ADA) is showing signs of a potential bullish breakout as key technical indicators align, suggesting upward momentum. With the market searching for direction, ADA’s price action is shaping up to be an intriguing setup for traders and investors alike.
Technical Indicators Point to Strength
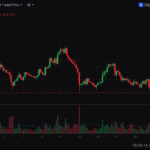
Currently, ADA is holding steady near the 200-day moving average (MA) at around $0.70. This level serves as a significant long-term support, providing a foundation for potential upward movement. Over the past day, ADA has already gained 5.67%, hinting at growing bullish sentiment.
A key development to watch is the formation of a golden cross—a bullish technical signal where a shorter-term moving average (in this case, the 23-day MA) crosses above a longer-term one (the 50-day MA). This pattern often signals a shift in momentum and has historically preceded strong upward trends in many assets.
Price Targets and Risk Factors
If ADA maintains its support above the 200-day MA and completes the golden cross, the next price targets lie at $0.85 and $1.00—both key resistance levels where selling pressure could increase. If buyers push past these levels, ADA could extend its rally further.
However, the bullish outlook is not without risks. Should the golden cross fail to materialize or the 200-day MA support break, ADA may retrace toward $0.65, which could test the patience of bullish traders.
Market Implications
Cardano’s price movement is not happening in isolation. A broader recovery in the crypto market or favorable developments in the project’s ecosystem could reinforce ADA’s bullish case. Conversely, macroeconomic factors or negative sentiment in the market could hinder its growth.
For those considering an entry into ADA, the current price levels present an interesting opportunity, but as always, risk management remains key.
Disclaimer: This article is for informational purposes only and does not constitute financial advice. Always conduct your own research before making investment decisions.


