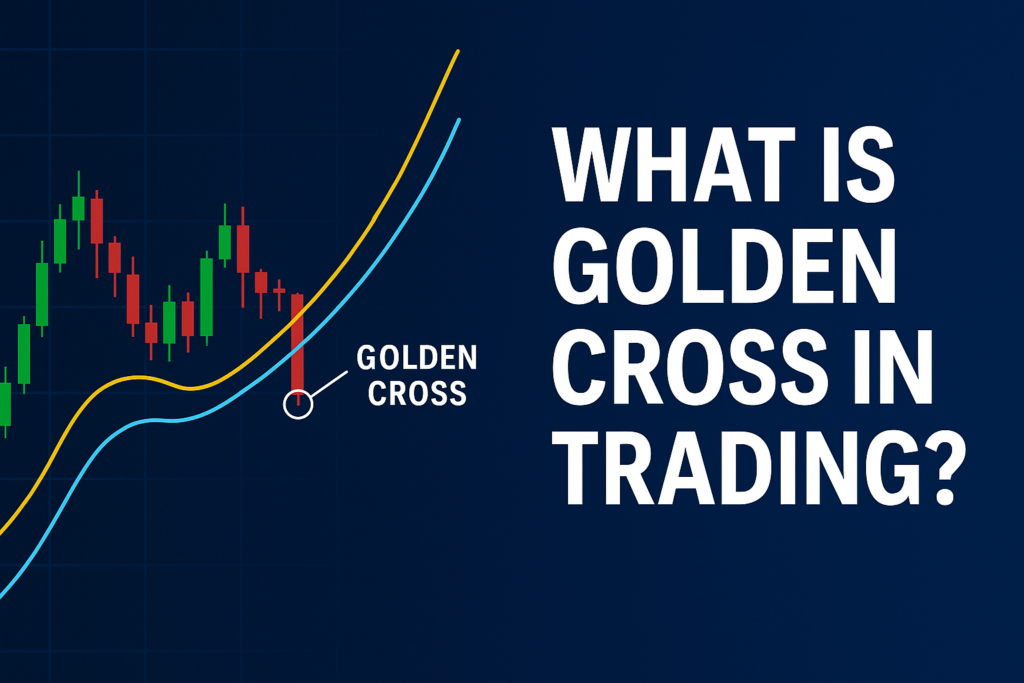
A Golden Cross is a bullish technical analysis pattern that signals the potential start of an uptrend. It occurs when a short-term moving average (typically the 50-day MA) crosses above a long-term moving average (usually the 200-day MA). This crossover suggests that buying momentum is increasing and a long-term rally may be forming.
How It Works
The Golden Cross unfolds in three phases:
- Downtrend ends – The price bottoms out as selling pressure fades.
- Crossover occurs – The 50-day MA rises and crosses above the 200-day MA.
- Uptrend begins – The market confirms bullish momentum with increasing volume.
Why It Matters
Traders and investors consider the Golden Cross a reliable buy signal, especially when supported by high trading volume and other indicators like RSI or MACD. It’s frequently used for:
- Confirming trend reversals
- Identifying entry points in long positions
- Setting a bullish outlook for assets like Bitcoin, S&P 500, or popular stocks
Real-Life Example
In 2020, the S&P 500 formed a Golden Cross after a sharp pandemic-driven selloff. This crossover marked the beginning of a sustained recovery that lasted over a year.
Bottom Line:
The Golden Cross is a classic trend reversal indicator with high credibility among traders. However, like all technical tools, it works best in combination with other signals and risk management strategies.