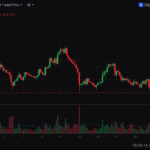
Bitcoin is once again drawing trader attention as it forms a familiar bearish setup: the dreaded bear flag. After a brief consolidation above $104,000, analysts are watching closely for a potential breakdown that could send BTC down to $97,000—or lower.
Classic Bear Flag in Play
Since bottoming out at $103,100 on May 31, BTC has moved within a narrow upward channel. This pattern, often a pause before continuation, is now raising alarms. A confirmed drop below the flag’s support—currently around $104,800—could trigger a decline toward the $97,690 region, calculated from the height of the flagpole.
Momentum indicators, particularly the RSI sitting at 44, support this bearish outlook, suggesting that sellers still have the upper hand in the short term.
Price Zones to Watch in June
With BTC down 6.3% from its $111,000 high, June is shaping up to be a battleground month. Analyst Daan Crypto Trades highlights $99,600 and $108,000 as the key levels. A push above $108K may set the stage for a retest of the ATH near $112K. However, if $99.6K fails, BTC could slip toward the 200-day SMA around $97.6K.
Another respected voice, AlphaBTC, forecasts a broader correction through the second week of June. If Bitcoin loses the $102K demand zone, a drop to the $92K yearly open becomes increasingly likely.
From there, it’s a coin toss: either a strong bounce sets the stage for new highs—or extended macro headwinds send Bitcoin tumbling toward $85,000.
Traders Stay Nimble
While the market lacks a clear directional bias, seasoned traders are opting for flexible strategies. With historical data showing June often brings muted price action, cautious entries and reactive positioning might outperform prediction-heavy plays.
⚠️ This content is not financial advice. All investments involve risk. Please do your own research before making any financial decisions.


