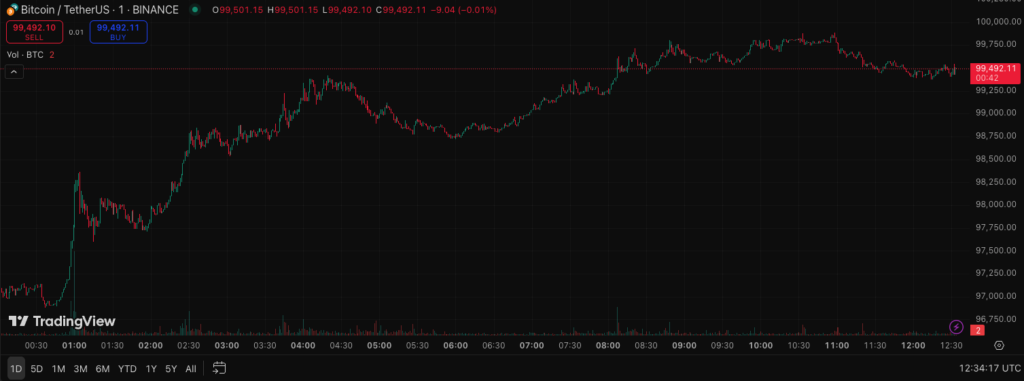
Bitcoin is once again testing a major psychological barrier as it hovers just below $100,000. After a strong multi-day rally from around $96,000, the market is now in a critical decision zone.
📊 Technical Overview
- Resistance: $99,750 – $100,000 (key breakout zone)
- Support: $98,500 (recent base), $96,000 (previous consolidation zone)
- RSI (1D): In overbought territory — suggesting caution
- EMA20 (1D): Price is holding above EMA — trend remains bullish
The daily chart shows a clear upward structure, with momentum pushing price into uncharted resistance territory. However, a visible decline in volume over the past 24 hours indicates potential exhaustion or hesitation at current levels.
🌐 Fundamental Drivers
- Institutional flows: Over $4.5B has flowed into BTC ETFs in the last 2 weeks — signaling strong institutional demand.
- Macro backdrop: Recent easing in US–UK trade tensions helped reduce global risk aversion, adding support to BTC.
- Regulatory news: Lack of progress on Bitcoin Strategic Reserve Act in the US may be capping short-term enthusiasm.
📈 Potential Scenarios
- Bullish: A breakout above $100K on strong volume could quickly trigger momentum toward $105,000–$108,000.
- Bearish: Failure to hold $98,500 may lead to a pullback toward the $96,000–$95,500 region.
Right now, the market is coiling. The next decisive move is likely to be fast and directional.
💡 Trader Insight
Don’t chase green candles blindly. Let the breakout confirm — or wait for a clean retest with rising volume. RSI suggests short-term cooling may be healthy.
This is not a signal — it’s structured thinking.
👥 Join the Discussion
We share market structure breakdowns and setups like this every day, with charts and community input.
Discord — clean, honest trading discussion. No hype, no spam.