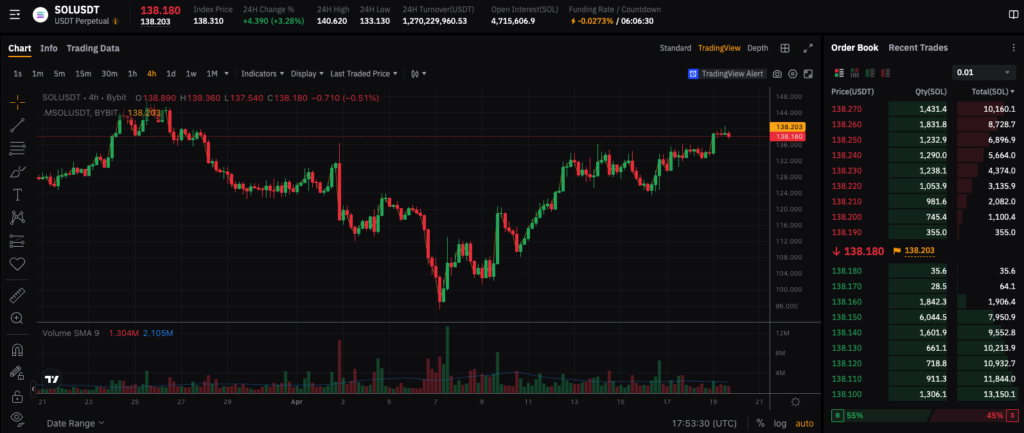
Solana (SOL) has staged a notable rebound from earlier April lows near $96, now approaching a key resistance zone around $140. After multiple higher lows and a steady climb, traders are watching closely to see if SOL can break above recent highs or face another rejection.
📌 Key Technical Levels
Resistance:
- $139–$140.60 – Local resistance zone; previously acted as a short-term top.
- $144–$148 – Major resistance level from late March; multiple rejections occurred here.
Support:
- $133 – Previous breakout level and immediate support.
- $127–$125 – Structural support area; break below this could indicate bearish reversal.
📊 Volume & Momentum
- Volume remains moderate. No major spikes suggest cautious participation.
- Price is consolidating near resistance, often a sign of potential breakout buildup.
- Momentum indicators (like RSI) are not yet overbought but show early signs of slowing.
🧠 Scenarios to Watch
✅ Bullish:
A breakout above $140.60 with strong volume could open the path toward the $144–$148 zone.
❌ Bearish:
Failure to clear $140 could lead to a rejection and short-term retracement to $133 or $127.
🔎 Additional Market Insights
- Funding Rate: Slightly negative (–0.0273%), showing some short positioning pressure.
- Order Book: Sell walls are building above $140, which may act as resistance unless volume increases.
- Structure: Higher lows remain intact, supporting a bullish short-term outlook if $133 holds.
🚀 Conclusion
SOL is approaching a major decision point. A clean breakout above $140 would confirm bullish momentum, while failure here may trigger another wave of selling. Traders should closely monitor volume and funding dynamics as SOL tests this key zone.
Disclaimer: This analysis is for informational purposes only and does not constitute investment advice. Always do your own research (DYOR) and practice proper risk management.